Choropleth Map
A Choropleth Map is a type of map that uses visual symbols (usually colors, shading, or hatching of varying density) to represent the distribution of a range of values on map subdivisions. Within multiple small subdivision units (administrative divisions or other subdivision units) of the entire mapping area, classifications are made according to the quantitative (relative) indicators of each subdivision, and corresponding color grades or hatching of different densities are used to reflect the concentration or development level distribution differences of phenomena in each area. It is most commonly seen in the visualization of election and census data, which are organized by geographic regions such as provinces and cities.
Introduction to Choropleth Maps
This method is also called color-graded statistical mapping because it commonly uses color grades for representation. The quantity of each subdivision on the map is represented using different color grades, with typical methods including: (1) mixed gradient from one color to another; (2) single-tone gradient; (3) transparent to opaque; (4) light to dark; (5) using a complete color spectrum variation. Choropleth maps rely on colors to express the inherent patterns in data, so choosing appropriate colors is very important. When the data value range is large or the data types are diverse, choosing appropriate color mapping can be quite challenging.
Choropleth maps’ biggest problem is the asymmetry between data distribution and geographic region size. Usually, large amounts of data are concentrated in densely populated areas, while sparsely populated areas occupy most of the screen space. Using large amounts of screen space to represent small portions of data is very uneconomical in terms of space utilization. This asymmetry often causes users to misunderstand the data and cannot help users accurately distinguish and compare data values in different subdivisions on the map.
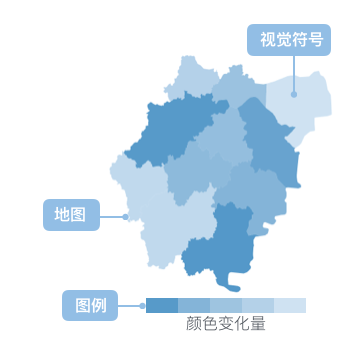
Other Names: Thematic Map, Shaded Map
Components of a Choropleth Map
| Chart Type | Choropleth Map |
|---|---|
| Suitable Data | One categorical field, one continuous field |
| Function | Compare numerical values of categorical data |
| Data-to-Visual Mapping | One categorical field maps to geographic locations on the map Another continuous field maps to color |
| Suitable Data Volume | Based on actual geographic location information, no limit |
Use Cases of Choropleth Maps
Suitable Use Cases
Choropleth maps are mostly used to reflect phenomena that are planar but sparsely distributed, such as population density, the ratio of sown area of a certain crop, and per capita income.
Example 1: Geographic Regional Data Visualization
The figure below shows the population distribution of US states. The main population distribution is reflected by the color depth. It is clear that California and Texas have the largest populations. It also shows the global gender ratio distribution in 2015, where the value represents the number of males per 100 females. It can be seen that in European and American countries, women generally slightly outnumber men. This phenomenon is particularly prominent in the former Soviet Union region, while the Middle East has more men than women.
| Data Type | Region/Country | Value | Description |
|---|---|---|---|
| Population | California | 38802500 | CA |
| Population | Texas | 26956958 | TX |
| Population | Florida | 19893297 | FL |
| … | … | … | … |
| Gender Ratio | Russia | 86.8 | Males per 100 females |
| Gender Ratio | China | 106.3 | Males per 100 females |
| Gender Ratio | Japan | 94.7 | Males per 100 females |
| … | … | … | … |
import { Chart } from '@antv/g2';
import { feature } from 'topojson-client';

// Load map and data
Promise.all([
  fetch('https://assets.antv.antgroup.com/g2/us-10m.json').then((res) =>
    res.json(),
  ),
  fetch('https://assets.antv.antgroup.com/g2/unemployment2.json').then((res) =>
    res.json(),
  ),
]).then(([us, unemployment]) => {
  const counties = feature(us, us.objects.counties).features;

  const chart = new Chart({
    container: 'container',
    autoFit: true,
  });

  chart.options({
    type: 'geoPath',
    coordinate: {
      type: 'albersUsa', // Use US-specific map projection
    },
    data: {
      value: counties,
      transform: [
        {
          type: 'join',
          join: unemployment,
          on: ['id', 'id'],
          select: ['rate'],
        },
      ],
    },
    scale: {
      color: {
        palette: 'ylGnBu', // Use yellow-to-blue gradient palette
        unknown: '#fff', // Display unknown data as white
      },
    },
    encode: {
      color: 'rate', // Map unemployment rate to color channel
    },
    legend: {
      color: {
        layout: { justifyContent: 'center' }, // Adjust legend layout
      },
    },
    style: {
      stroke: '#666',
      strokeWidth: 0.5,
    },
    tooltip: {
      title: (d) => d.properties.name,
      items: [{ field: 'rate', name: 'Unemployment Rate' }],
    },
  });

  chart.render();
});
Note:
- The numeric field is mapped to color, representing the size of the data.
- The name of the geographic area determines where the area is drawn on the map.
- For smaller blocks, because the value is also smaller, the rendered color is also lighter, making these blocks difficult to see on the map. This is also a limitation of choropleth maps.
Unsuitable Use Cases
- Displaying Precise Values: Choropleth maps are mainly used to show the relative size and distribution trend of data, and are not suitable for scenarios that require precise numerical reading.
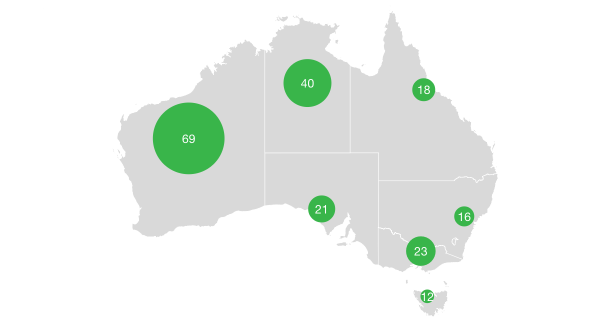
- Excessive Differences in Regional Area: When the regional area differences are very large, the larger area will visually dominate, even if its corresponding value is small, which may mislead users. At this time, consider using other types of maps such as bubble maps.
- Data Not Geographically Relevant: If the data is not directly related to geographic location, using a choropleth map is meaningless.
Example 1: 2008 US Presidential Election Results
Election visualization can easily give users the illusion of asymmetry between data distribution and geographic area size. States won by Democratic candidate Obama and Republican candidate McCain are represented in blue and red, respectively. From the map, it appears that the Republican Party received more votes than the Democratic Party because the red area occupies a larger area. However, in the US presidential election, the final result depends on the number of electoral votes obtained by the candidate. Each state has a different number of electoral votes, and the candidate who wins in a state will receive all the electoral votes of that state. At this time, it is recommended to use a dot map.
| State | Electoral Votes | Obama Votes | McCain Votes |
|---|---|---|---|
| Alabama | 9 | 813479 | 1266546 |
| Arizona | 10 | 1034707 | 638017 |
| Arkansas | 6 | 422310 | 638017 |
Comparing Choropleth Maps to Other Charts
Choropleth Maps and Bubble Maps
- Choropleth Maps: Maps numerical values to the color of map areas, suitable for displaying the distribution of continuous data.
- Bubble Maps: Displays a bubble on the map area, with the size of the bubble representing the numerical value, suitable for displaying discrete point data or avoiding misleading when regional area differences are large.
Choropleth maps can often lead to misjudgment, as large areas may have small numerical values (population, electoral votes, etc.).
Choropleth Maps and Dot Maps
- Dot Maps: Mainly used to display data at a specific longitude and latitude, while choropleth maps are used to display statistical values for a certain area.
- Dot Maps: Can display a large amount of data values, while choropleth maps are limited by the display area.