堆叠面积图
上一篇
点描法地图
下一篇
堆叠柱状图
Loading...

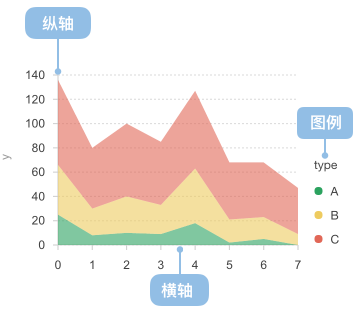
堆叠面积图和基本面积图一样,唯一的区别就是图上每一个数据集的起点不同,起点是基于前一个数据集的,用于显示每个数值所占大小随时间或类别变化的趋势线,展示的是部分与整体的关系。
堆叠面积图上的最大的面积代表了所有的数据量的总和,是一个整体。各个叠起来的面积表示各个数据量的大小,这些堆叠起来的面积图在表现大数据的总量分量的变化情况时格外有用,所以堆叠面积图不适用于表示带有负值的数据集。非常适用于对比多变量随时间变化的情况。
在堆叠面积图的基础之上,将各个面积的因变量的数据使用加和后的总量进行归一化就形成了百分比堆叠面积图。该图并不能反映总量的变化,但是可以清晰的反应每个数值所占百分比随时间或类别变化的趋势线,对于分析自变量是大数据、时变数据、有序数据时各个指标分量占比极为有用。
英文名:Stacked Area Chart
| 图表类型 | 层叠面积图 |
|---|---|
| 适合的数据 | 一个分类字段数据,两个连续字段数据 |
| 功能 | 对比每个分组数据的变化趋势 |
| 数据与图形的映射 | 两个连续字段分别映射到横轴和纵轴 另一个分类数据映射到图形的颜色 |
| 适合的数据条数 | 映射到颜色的分类不超过 12 个;每种分类的数据不少于两条 |
import { Chart } from '@antv/g2';const chart = new Chart({ container: 'container', theme: 'classic' });chart.options({type: 'area',autoFit: true,data: [{ country: 'Asia', year: '1750', value: 502 },{ country: 'Asia', year: '1800', value: 635 },{ country: 'Asia', year: '1850', value: 809 },{ country: 'Asia', year: '1900', value: 5268 },{ country: 'Asia', year: '1950', value: 4400 },{ country: 'Asia', year: '1999', value: 3634 },{ country: 'Asia', year: '2050', value: 947 },{ country: 'Africa', year: '1750', value: 106 },{ country: 'Africa', year: '1800', value: 107 },{ country: 'Africa', year: '1850', value: 111 },{ country: 'Africa', year: '1900', value: 1766 },{ country: 'Africa', year: '1950', value: 221 },{ country: 'Africa', year: '1999', value: 767 },{ country: 'Africa', year: '2050', value: 133 },{ country: 'Europe', year: '1750', value: 163 },{ country: 'Europe', year: '1800', value: 203 },{ country: 'Europe', year: '1850', value: 276 },{ country: 'Europe', year: '1900', value: 628 },{ country: 'Europe', year: '1950', value: 547 },{ country: 'Europe', year: '1999', value: 729 },{ country: 'Europe', year: '2050', value: 408 },{ country: 'Oceania', year: '1750', value: 200 },{ country: 'Oceania', year: '1800', value: 200 },{ country: 'Oceania', year: '1850', value: 200 },{ country: 'Oceania', year: '1900', value: 460 },{ country: 'Oceania', year: '1950', value: 230 },{ country: 'Oceania', year: '1999', value: 300 },{ country: 'Oceania', year: '2050', value: 300 },],encode: { x: 'year', y: 'value', color: 'country' },axis: { x: { title: false }, y: { title: false } },transform: [{type: 'stackY',},],});chart.render();
1. 分类数据的比较不要用堆叠面积图
堆叠面积图(不推荐)
import { Chart } from '@antv/g2';const chart = new Chart({ container: 'container', theme: 'classic' });chart.options({type: 'area',autoFit: true,data: [{ year: '2001', genre: 'Strategy', sold: 11500 },{ year: '2001', genre: 'Sports', sold: 27500 },{ year: '2001', genre: 'Action', sold: 6000 },{ year: '2001', genre: 'Shooter', sold: 3500 },{ year: '2001', genre: 'Other', sold: 1500 },{ year: '2002', genre: 'Strategy', sold: 10500 },{ year: '2002', genre: 'Sports', sold: 29500 },{ year: '2002', genre: 'Action', sold: 8000 },{ year: '2002', genre: 'Shooter', sold: 4500 },{ year: '2002', genre: 'Other', sold: 1800 },{ year: '2003', genre: 'Strategy', sold: 12500 },{ year: '2003', genre: 'Sports', sold: 30500 },{ year: '2003', genre: 'Action', sold: 4000 },{ year: '2003', genre: 'Shooter', sold: 6500 },{ year: '2003', genre: 'Other', sold: 2000 },{ year: '2004', genre: 'Strategy', sold: 14500 },{ year: '2004', genre: 'Sports', sold: 31500 },{ year: '2004', genre: 'Action', sold: 5000 },{ year: '2004', genre: 'Shooter', sold: 6800 },{ year: '2004', genre: 'Other', sold: 1800 },],encode: { x: 'year', y: 'sold', color: 'genre' },axis: { x: { title: false }, y: { title: false } },transform: [{type: 'stackY',},],});chart.render();
堆叠柱状图(推荐)
import { Chart } from '@antv/g2';const chart = new Chart({ container: 'container', theme: 'classic' });chart.options({type: 'interval',autoFit: true,data: [{ year: '2001', genre: 'Strategy', sold: 11500 },{ year: '2001', genre: 'Sports', sold: 27500 },{ year: '2001', genre: 'Action', sold: 6000 },{ year: '2001', genre: 'Shooter', sold: 3500 },{ year: '2001', genre: 'Other', sold: 1500 },{ year: '2002', genre: 'Strategy', sold: 10500 },{ year: '2002', genre: 'Sports', sold: 29500 },{ year: '2002', genre: 'Action', sold: 8000 },{ year: '2002', genre: 'Shooter', sold: 4500 },{ year: '2002', genre: 'Other', sold: 1800 },{ year: '2003', genre: 'Strategy', sold: 12500 },{ year: '2003', genre: 'Sports', sold: 30500 },{ year: '2003', genre: 'Action', sold: 4000 },{ year: '2003', genre: 'Shooter', sold: 6500 },{ year: '2003', genre: 'Other', sold: 2000 },{ year: '2004', genre: 'Strategy', sold: 14500 },{ year: '2004', genre: 'Sports', sold: 31500 },{ year: '2004', genre: 'Action', sold: 5000 },{ year: '2004', genre: 'Shooter', sold: 6800 },{ year: '2004', genre: 'Other', sold: 1800 },],encode: { x: 'year', y: 'sold', color: 'genre' },axis: { x: { title: false }, y: { title: false } },transform: [{type: 'stackY',},],});chart.render();
将每个时间点的总和归一化为 100%,突出各部分的占比变化。
import { Chart } from '@antv/g2';const chart = new Chart({ container: 'container' });chart.options({type: 'view',autoFit: true,data: [{ country: 'Asia', year: '1750', value: 502 },{ country: 'Asia', year: '1800', value: 635 },{ country: 'Asia', year: '1850', value: 809 },{ country: 'Asia', year: '1900', value: 947 },{ country: 'Asia', year: '1950', value: 1402 },{ country: 'Asia', year: '1999', value: 3634 },{ country: 'Asia', year: '2050', value: 5268 },{ country: 'Africa', year: '1750', value: 106 },{ country: 'Africa', year: '1800', value: 107 },{ country: 'Africa', year: '1850', value: 111 },{ country: 'Africa', year: '1900', value: 133 },{ country: 'Africa', year: '1950', value: 221 },{ country: 'Africa', year: '1999', value: 767 },{ country: 'Africa', year: '2050', value: 1766 },{ country: 'Europe', year: '1750', value: 163 },{ country: 'Europe', year: '1800', value: 203 },{ country: 'Europe', year: '1850', value: 276 },{ country: 'Europe', year: '1900', value: 408 },{ country: 'Europe', year: '1950', value: 547 },{ country: 'Europe', year: '1999', value: 729 },{ country: 'Europe', year: '2050', value: 628 },],encode: { x: 'year', y: 'value', color: 'country' },transform: [{ type: 'stackY' }, { type: 'normalizeY' }],axis: { x: { title: false }, y: { title: false, labelFormatter: '.0%' } },children: [{type: 'area',tooltip: { items: [{ channel: 'y0', valueFormatter: '.0%' }] },},{ type: 'line', tooltip: false },],});chart.render();
通过设置渐变色填充,让堆叠面积图更加美观,突出数据的层次感。
import { Chart } from '@antv/g2';const chart = new Chart({container: 'container',theme: 'classic',autoFit: true,});chart.options({type: 'area',data: {type: 'fetch',value: 'https://assets.antv.antgroup.com/g2/stocks.json',transform: [{type: 'filter',callback: (d) => d.symbol === 'GOOG',},],},encode: {x: (d) => new Date(d.date),y: 'price',},style: {fill: 'linear-gradient(-90deg, white 0%, darkgreen 100%)',},axis: { x: { title: false }, y: { title: false } },});chart.render();
河流图是一种特殊的堆叠面积图,通过对称分布展示数据的流动变化,特别适合展示多个类别随时间的变化趋势。
import { Chart } from '@antv/g2';const chart = new Chart({container: 'container',theme: 'classic',autoFit: true,});chart.options({type: 'area',data: {type: 'fetch',value: 'https://assets.antv.antgroup.com/g2/unemployment-by-industry.json',},encode: {x: (d) => new Date(d.date),y: 'unemployed',color: 'industry',},transform: [{ type: 'stackY' },{ type: 'symmetryY' }, // 对称分布],axis: { x: { title: false }, y: { title: false } },});chart.render();
瀑布面积图展示不同类别数据的层叠效果,通过特殊的排序和平滑曲线展现数据的流动感。
import { Chart } from '@antv/g2';const chart = new Chart({container: 'container',theme: 'classic',autoFit: true,});chart.options({type: 'area',data: {type: 'fetch',value:'https://gw.alipayobjects.com/os/bmw-prod/f38a8ad0-6e1f-4bb3-894c-7db50781fdec.json',},encode: {x: (d) => new Date(d.year),y: 'revenue',series: 'format',color: 'group',shape: 'smooth', // 平滑曲线},transform: [{type: 'stackY',orderBy: 'maxIndex',reverse: true,},],axis: {x: { title: false },y: { title: false, labelFormatter: '~s' },},tooltip: { channel: 'y', valueFormatter: '.2f' },});chart.render();