
折线图
上一篇
玉珏图
下一篇
直方图
Loading...
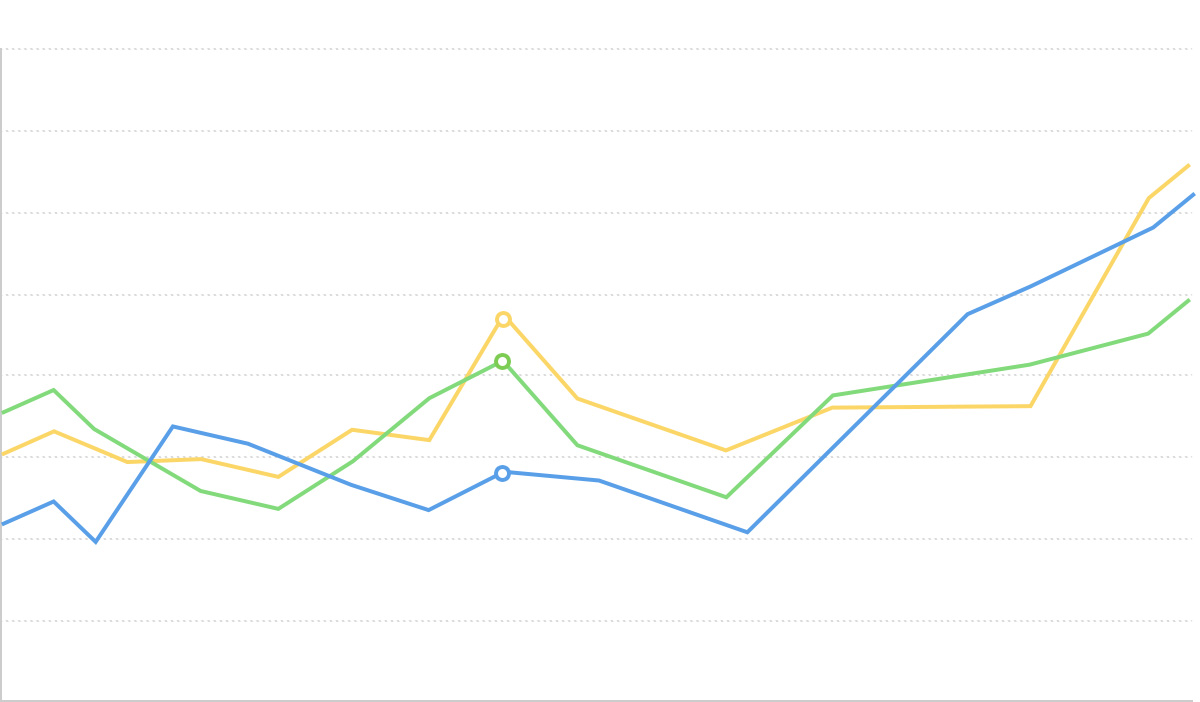
折线图是一种将数据点按时间或类别顺序连接成一条折线,用于显示数据随时间或有序类别变化趋势的统计图表。通过折线的上升或下降,可以直观地表现数据变化的速度、幅度、范围及其周期性。
折线图特别适合展示连续时间序列的数据变化,能够有效地反映数据的趋势、波动、周期性和异常点。在多系列数据比较时,折线图通过不同颜色或样式的线条,清晰地展示各数据系列间的对比和关系。
相比于面积图,折线图更侧重于展示数据变化的趋势和轨迹,而非总量;相比于柱状图,折线图更适合展示连续变化的趋势,而非离散的数值比较。
英文名:Line Chart
| 图表类型 | 基础折线图 |
|---|---|
| 适合的数据 | 时间序列数据:一个有序/连续数据字段(通常是时间)、一个连续数据字段 |
| 功能 | 展示数据随时间或有序维度的变化趋势 |
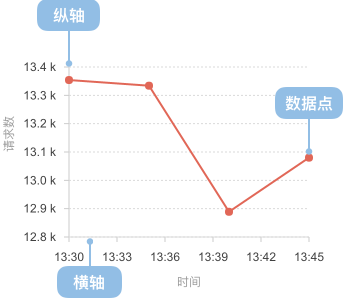
| 数据与图形的映射 | 时间字段映射到横轴的位置 数值字段映射到纵轴的高度 各数据点通过线条连接,展示变化轨迹 |
| 适合的场景 | 单一数据系列随时间的变化趋势 |
| 图表类型 | 多系列折线图 |
|---|---|
| 适合的数据 | 多序列时间数据:一个有序/连续数据字段(通常是时间)、一个连续数据字段、一个分类数据字段 |
| 功能 | 展示多个数据系列随时间变化的趋势,便于比较不同系列间的关系 |
| 数据与图形的映射 | 时间字段映射到横轴的位置 数值字段映射到纵轴的高度 分类字段映射到不同颜色的线条 |
| 适合的场景 | 多数据系列随时间的变化趋势对比 |
例子 1: 适合展示连续时间序列的趋势
下图是一个股票价格走势的折线图,展示了某公司股票价格随时间的变化趋势。
| date(日期) | close(收盘价) |
|---|---|
| 2015/1/5 | 121.73 |
| 2015/1/6 | 115.07 |
| 2015/1/7 | 116.75 |
| ... | ... |
import { Chart } from '@antv/g2';const chart = new Chart({container: 'container',theme: 'classic',});chart.options({type: 'line',autoFit: true,data: {type: 'fetch',value: 'https://assets.antv.antgroup.com/g2/aapl.json',transform: [{type: 'map',callback: (d) => ({...d,date: new Date(d.date),}),},],},encode: { x: 'date', y: 'close' },axis: {x: {title: null,},y: {title: null,},},style: {lineWidth: 2,stroke: '#1890ff',},});chart.render();
说明 :
date 字段,映射到横轴的位置,表示时间的先后顺序close 字段,映射到纵轴的高度,展示了价格随时间的变化趋势例子 2: 适合展示多个数据系列的对比趋势
多系列折线图可以同时展示多个数据系列随时间的变化,便于进行比较分析。下图展示了不同地区失业率的变化趋势。
import { Chart } from '@antv/g2';const chart = new Chart({container: 'container',theme: 'classic',});chart.options({type: 'line',autoFit: true,data: {type: 'fetch',value:'https://gw.alipayobjects.com/os/bmw-prod/728a4bdc-9d0b-49e0-a92f-6320a6cddeed.csv',},encode: {x: 'date',y: 'unemployment',color: 'division',},axis: {x: {title: null,},y: {title: null,},},});chart.render();
说明:
date 字段映射到横轴,表示时间维度unemployment 字段映射到纵轴,表示失业率division 字段映射到颜色,区分不同地区例子 3: 展示数据的细微变化和波动
折线图可以清晰地展示数据的细微变化和波动,特别是当数据点较多且变化频繁时。
import { Chart } from '@antv/g2';const chart = new Chart({container: 'container',theme: 'classic',});chart.options({type: 'line',autoFit: true,data: [{ month: 'Jan', city: 'Tokyo', temperature: 7 },{ month: 'Jan', city: 'London', temperature: 3.9 },{ month: 'Feb', city: 'Tokyo', temperature: 6.9 },{ month: 'Feb', city: 'London', temperature: 4.2 },{ month: 'Mar', city: 'Tokyo', temperature: 9.5 },{ month: 'Mar', city: 'London', temperature: 5.7 },{ month: 'Apr', city: 'Tokyo', temperature: 14.5 },{ month: 'Apr', city: 'London', temperature: 8.5 },{ month: 'May', city: 'Tokyo', temperature: 18.4 },{ month: 'May', city: 'London', temperature: 11.9 },{ month: 'Jun', city: 'Tokyo', temperature: 21.5 },{ month: 'Jun', city: 'London', temperature: 15.2 },{ month: 'Jul', city: 'Tokyo', temperature: 25.2 },{ month: 'Jul', city: 'London', temperature: 17 },{ month: 'Aug', city: 'Tokyo', temperature: 26.5 },{ month: 'Aug', city: 'London', temperature: 16.6 },{ month: 'Sep', city: 'Tokyo', temperature: 23.3 },{ month: 'Sep', city: 'London', temperature: 14.2 },{ month: 'Oct', city: 'Tokyo', temperature: 18.3 },{ month: 'Oct', city: 'London', temperature: 10.3 },{ month: 'Nov', city: 'Tokyo', temperature: 13.9 },{ month: 'Nov', city: 'London', temperature: 6.6 },{ month: 'Dec', city: 'Tokyo', temperature: 9.6 },{ month: 'Dec', city: 'London', temperature: 4.8 },],encode: { x: 'month', y: 'temperature', color: 'city' },axis: {y: {title: null,labelFormatter: (d) => d + '°C',},x: {title: null,},},style: {lineWidth: 2,},});chart.render();
说明:
例子 1: 不适合展示离散类别的比较
当水平轴的数据类型为无序的分类或者垂直轴的数据类型为连续时间时,不适合使用折线图。
我们以一个不同游戏类型的销量对比的场景为例,对于表示分类对比的数据时,我们更应该使用柱状图,而不是折线图。
错误的做法
import { Chart } from '@antv/g2';const chart = new Chart({container: 'container',theme: 'classic',height: 250,});chart.options({type: 'line',autoFit: true,data: [{ genre: 'Sports', sold: 27500 },{ genre: 'Strategy', sold: 11500 },{ genre: 'Action', sold: 6000 },{ genre: 'Shooter', sold: 3500 },{ genre: 'Other', sold: 1500 },],encode: { x: 'genre', y: 'sold' },axis: {x: {title: '游戏类型',},y: {title: '销售量',labelFormatter: (val) => val / 1000 + 'k',},},style: {lineWidth: 3,stroke: '#1890ff',},});chart.render();
正确的做法
import { Chart } from '@antv/g2';const chart = new Chart({container: 'container',theme: 'classic',height: 250,});chart.options({type: 'interval',autoFit: true,data: [{ genre: 'Sports', sold: 27500 },{ genre: 'Strategy', sold: 11500 },{ genre: 'Action', sold: 6000 },{ genre: 'Shooter', sold: 3500 },{ genre: 'Other', sold: 1500 },],encode: { x: 'genre', y: 'sold', color: 'genre' },axis: {x: {title: '游戏类型',},y: {title: '销售量',labelFormatter: (val) => val / 1000 + 'k',},},});chart.render();
问题说明:
例子 2: 数据点较少或变化不明显时效果不佳
当数据点较少或变化不明显时,折线图可能无法充分发挥其展示趋势变化的优势。这种情况下,可以考虑使用柱状图或点图来强调个别数据点的比较。
import { Chart } from '@antv/g2';const chart = new Chart({container: 'container',theme: 'classic',});chart.options({type: 'line',autoFit: true,data: [{ quarter: 'Q1', value: 100 },{ quarter: 'Q2', value: 101 },{ quarter: 'Q3', value: 99 },{ quarter: 'Q4', value: 102 },],encode: { x: 'quarter', y: 'value' },axis: {x: { title: null },y: { title: null },},style: {lineWidth: 2,stroke: '#1890ff',},});chart.render();
问题说明:
阶梯折线图使用水平和垂直线段连接数据点,形成阶梯状的效果,适合展示在特定时间点发生突变的数据。
import { Chart } from '@antv/g2';const chart = new Chart({container: 'container',theme: 'classic',});chart.options({type: 'line',autoFit: true,data: [{ month: 'Jan', value: 51 },{ month: 'Feb', value: 91 },{ month: 'Mar', value: 34 },{ month: 'Apr', value: 47 },{ month: 'May', value: 63 },{ month: 'June', value: 58 },{ month: 'July', value: 56 },{ month: 'Aug', value: 77 },{ month: 'Sep', value: 99 },{ month: 'Oct', value: 106 },{ month: 'Nov', value: 88 },{ month: 'Dec', value: 56 },],encode: { x: 'month', y: 'value', shape: 'hv' },axis: {x: {title: null,},y: {title: null,},},style: {lineWidth: 2,stroke: '#1890ff',},});chart.render();
说明:
encode: { shape: 'hv' } 指定阶梯状的线条形状虚线折线图通过不同的线型来区分不同的数据系列或表示特定含义,如预测值、参考线等。
import { Chart } from '@antv/g2';const chart = new Chart({container: 'container',theme: 'classic',});chart.options({type: 'view',autoFit: true,data: [{ year: '1991', value: 3, type: '实际值' },{ year: '1992', value: 4, type: '实际值' },{ year: '1993', value: 3.5, type: '实际值' },{ year: '1994', value: 5, type: '实际值' },{ year: '1995', value: 4.9, type: '实际值' },{ year: '1996', value: 6, type: '实际值' },{ year: '1997', value: 7, type: '实际值' },{ year: '1998', value: 9, type: '实际值' },{ year: '1999', value: 13, type: '实际值' },{ year: '1999', value: 13, type: '预测值' },{ year: '2000', value: 16, type: '预测值' },{ year: '2001', value: 21, type: '预测值' },{ year: '2002', value: 25, type: '预测值' },{ year: '2003', value: 30, type: '预测值' },],children: [{type: 'line',encode: { x: 'year', y: 'value', color: 'type' },style: {lineWidth: 2,lineDash: (d) => (d[0].type === '预测值' ? [4, 4] : null),},},{type: 'point',encode: { x: 'year', y: 'value', color: 'type', shape: 'circle' },},],scale: {color: {range: ['#1890FF', '#FF6B3B'],},},axis: {x: { title: null },y: { title: null },},});chart.render();
说明:
lineDash: (d) => (d[0].type === '预测值' ? [4, 4] : null) 为预测值设置虚线样式

