
编码映射(Encode)
上一篇
sortBy
下一篇
概览
Loading...
数据可视化的核心内容是可视化编码,是将数据信息映射成可视化元素的技术。就像数据包含属性和值,可视化编码也由两部分组成:图形标记(Mark) 和 视觉通道(Channel)。
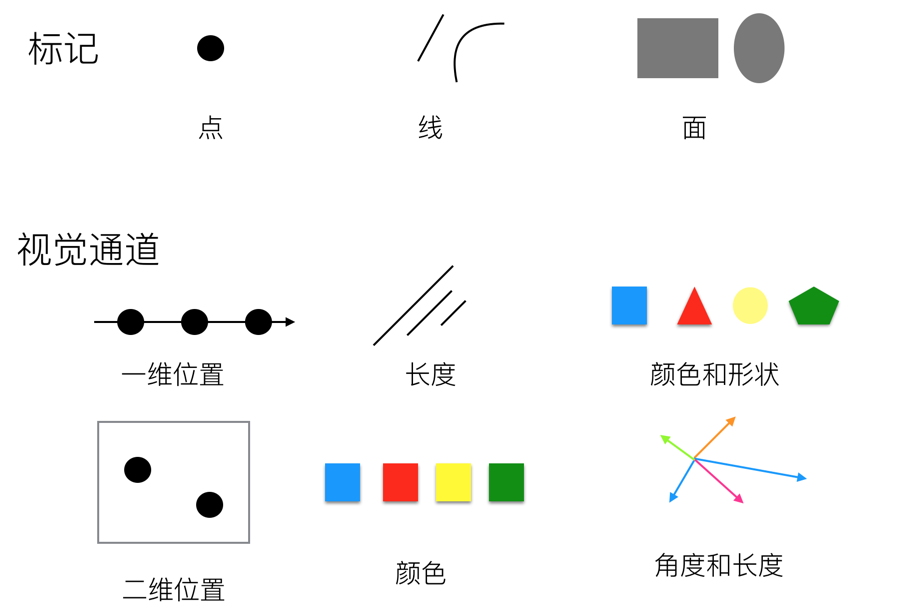
视觉通道也可以称为图表属性,原始数据与视觉通道之间的映射关系使我们能迅速获取信息。所以我们可以把图表看成一组图形标记的组合,这些图形标记中携带了一些信息,我们称作它 编码 了一些信息。而当人们从这些符号中读取信息时,我们称作我们 解码 了一些信息。
人类对视觉通道的识别有两种基本的感知模式。第一种感知模式得到的信息是关于对象本身的特征和位置等,对应视觉通道的定性性质和分类性质;第二种感知模式得到的信息是对象某一属性在数值上的大小,对应视觉通道的定量性质或者定序性质。因此我们将视觉通道分为 两大类:
然而两种分类不是绝对的,例如位置信息,既可以区分不同的分类,又可以分辨连续数据的差异。
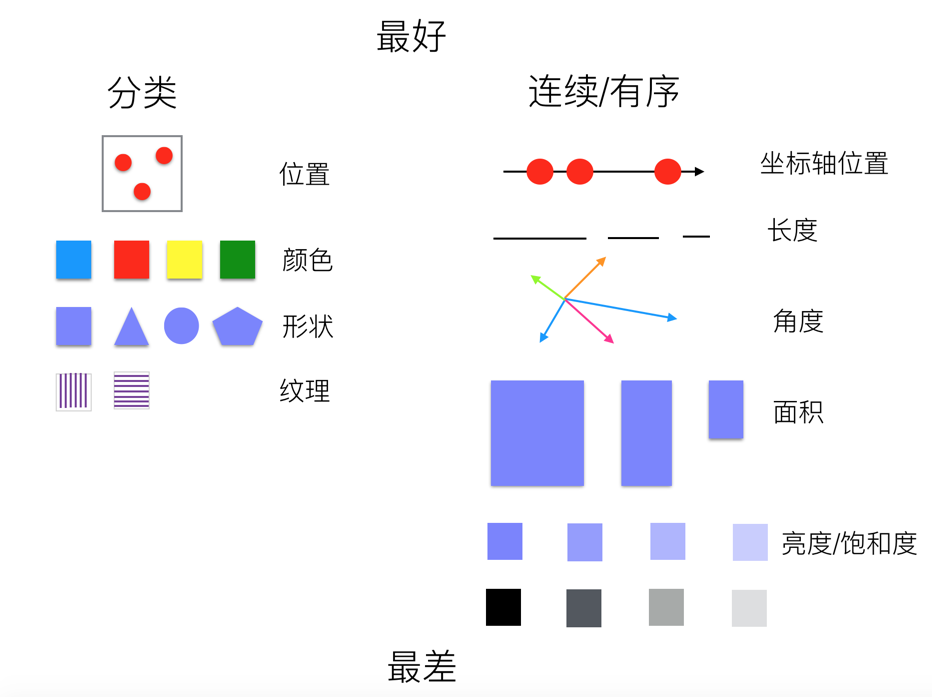
进行可视化编码时我们需要考虑不同视觉通道的表现力和有效性,主要体现在下面几个方面:
以下是视觉通道的表现力从最好到最差的示意图:
对应视觉编码中的视觉通道,G2 中的视觉通道可以分为以下五种图形属性:

| 视觉通道 | 描述 |
|---|---|
| x | 定义元素在水平方向的位置 |
| y | 定义元素在垂直方向的位置 |
| z | 定义元素在三维空间中的深度位置 |
| x1 | 定义元素水平方向的终止位置 |
| y1 | 定义元素垂直方向的终止位置,堆叠柱状图的内部实现就是计算了 y1 通道的值 |
| series | 通过空间位置区分不同数据系列 |
| position | 自定义复合图表显示位置,用于平行坐标系和圆形分面图等 |
| position${number} | 自定义复合图表显示位置,用于平行坐标系和圆形分面图等 |


| 视觉通道 | 描述 |
|---|---|
| color | 通过色调映射数据分类属性 |
| opacity | 控制元素的透明度,常用于突出焦点或表达数值强度(如热力图的渐变透明度) |

| 视觉通道 | 描述 |
|---|---|
| shape | 通过几何形态区分数据类别,适合分类数据编码 |

| 视觉通道 | 描述 |
|---|---|
| size | 控制元素的物理尺寸(点半径/线宽/柱宽),适合编码定量数据 |

| 视觉通道 | 描述 |
|---|---|
| key | 动画元素唯一标识符,用于数据更新 |
| groupKey | 动画分组标识符,用于数据更新 |
| enterType | 元素进入场景的动画类型(如缩放/淡入) |
| enterEasing | 进入动画的缓动函数 |
| enterDuration | 进入动画持续时间 |
| enterDelay | 进入动画延迟时间 |
| updateType | 数据更新时的过渡动画类型 |
| updateEasing | 更新动画的缓动函数 |
| updateDuration | 更新动画持续时间 |
| updateDelay | 更新动画延迟时间 |
| exitType | 元素退出场景的动画类型(如滑动消失) |
| exitEasing | 退出动画的缓动函数 |
| exitDuration | 退出动画持续时间 |
| exitDelay | 退出动画延迟时间 |
为了控制标记的样式,我们往往会把一列数据和它的某一项视觉通道绑定。
下面是一组筹备活动的时间数据:
table([{ name: '活动策划', startTime: 1, endTime: 4 },{ name: '场地物流规划', startTime: 3, endTime: 13 },{ name: '选择供应商', startTime: 5, endTime: 8 },{ name: '租赁场地', startTime: 9, endTime: 13 },{ name: '预定餐饮服务商', startTime: 10, endTime: 14 },{ name: '租赁活动装饰团队', startTime: 12, endTime: 17 },{ name: '彩排', startTime: 14, endTime: 16 },{ name: '活动庆典', startTime: 17, endTime: 18 },]);
在下面的例子中,我们把数据中 name 一列数据和 x 通道绑定,endTime 列数据减去 startTime 列数据的值和 y 通道绑定。这种绑定的过程被称为编码(Encode),我们常常说图形的某个视觉属性编码了一列数据,这种数据驱动的属性被称为通道(Channel)。比如下面的 interval 标记 的 x,y 通道都分别编码了对应列的数据,可以清晰地显示不同事项和消耗时间的关系。
import { Chart } from '@antv/g2';const chart = new Chart({container: 'container',});chart.options({type: 'interval',autoFit: true,data: [{ name: '活动策划', startTime: 1, endTime: 4 },{ name: '场地物流规划', startTime: 3, endTime: 13 },{ name: '选择供应商', startTime: 5, endTime: 8 },{ name: '租赁场地', startTime: 9, endTime: 13 },{ name: '预定餐饮服务商', startTime: 10, endTime: 14 },{ name: '租赁活动装饰团队', startTime: 12, endTime: 17 },{ name: '彩排', startTime: 14, endTime: 16 },{ name: '活动庆典', startTime: 17, endTime: 18 },],encode: {x: 'name', // 事项名称字段映射X轴位置y: (datum) => datum.endTime - datum.startTime, // 结束时间减去开始时间映射Y轴位置},coordinate: { transform: [{ type: 'transpose' }] },axis: {x: {title: '事项',},y: {title: '消耗时间',},},});chart.render();
当我们想进一步分析事项的时序关系的时候,就需要借助其他的视觉通道。
在下面的例子中,我们把数据中 startTime 一列数据和 y 通道绑定,endTime 一列数据和 y1 通道绑定(当然,你也可以将[startTime, endTime]绑定到 y 通道,详见数组通道),通过这样的数据编码方式来实现一个甘特图的效果。为了更好的区分不同事项,在 x 通道编码了 name 列的数据以外,额外把数据中 name 一列数据和 color 通道也进行绑定,这样通过不同的颜色以及不同的 x 轴位置,我们能够更好地区分不同事项。
import { Chart } from '@antv/g2';const chart = new Chart({container: 'container',});chart.options({type: 'interval',autoFit: true,data: [{ name: '活动策划', startTime: 1, endTime: 4 },{ name: '场地物流规划', startTime: 3, endTime: 13 },{ name: '选择供应商', startTime: 5, endTime: 8 },{ name: '租赁场地', startTime: 9, endTime: 13 },{ name: '预定餐饮服务商', startTime: 10, endTime: 14 },{ name: '租赁活动装饰团队', startTime: 12, endTime: 17 },{ name: '彩排', startTime: 14, endTime: 16 },{ name: '活动庆典', startTime: 17, endTime: 18 },],encode: {x: 'name', // 事项名称字段映射X轴位置y: 'startTime', // 事项开始时间字段映射y位置y1: 'endTime', // 事项结束时间字段映射y1轴位置color: 'name', // 事项名称字段映射颜色},coordinate: { transform: [{ type: 'transpose' }] },axis: {x: {title: '事项',},y: {title: '时间',},},});chart.render();
这已经是一个较为完整的甘特图了,如果想强化时间顺序,可以借助 G2 中动画相关的视觉通道来实现时序动画的效果,下面的例子对 enterDuration 通道和 enterDelay 通道进行了编码,使得不同事项对应的标记的进入动画延迟时间和持续时间跟数据里的开始时间和结束时间相关联。
import { Chart } from '@antv/g2';const chart = new Chart({container: 'container',});chart.options({type: 'interval',autoFit: true,data: [{ name: '活动策划', startTime: 1, endTime: 4 },{ name: '场地物流规划', startTime: 3, endTime: 13 },{ name: '选择供应商', startTime: 5, endTime: 8 },{ name: '租赁场地', startTime: 9, endTime: 13 },{ name: '预定餐饮服务商', startTime: 10, endTime: 14 },{ name: '租赁活动装饰团队', startTime: 12, endTime: 17 },{ name: '彩排', startTime: 14, endTime: 16 },{ name: '活动庆典', startTime: 17, endTime: 18 },],encode: {x: 'name', // 事项名称字段映射X轴位置y: 'startTime', // 事项开始时间字段映射y位置y1: 'endTime', // 事项结束时间字段映射y1轴位置color: 'name', // 事项名称字段映射颜色enterDuration: (datum) => datum.endTime - datum.startTime, // 事项结束时间减去开始时间映射进入动画持续时间enterDelay: 'startTime', // 事项开始时间映射进入动画延迟时间},scale: { enterDuration: { zero: true, range: [0, 3000] } },coordinate: { transform: [{ type: 'transpose' }] },axis: {x: {title: '事项',},y: {title: '时间',},},});chart.render();
G2 中编码(Encode) 主要用于指定视觉元素属性和数据之间的关系,可以在 Mark 层级指定编码:
({type: 'interval',encode: {x: 'name',y: 'value',},});
// API// 第一种chart.interval().encode('x', 'name').encode('y', 'value');// 第二种chart.interval().encode({ x: 'name', y: 'value' });
也可以在 View 层级指定编码:
({type: 'view',encode: {x: 'name',y: 'value',},});
// API// 第一种chart.encode('x', 'name').encode('y', 'value');// 第二种chart.encode({ x: 'name', y: 'value' });
通道编码具有传递性,视图的编码会传递给 children 指定的标记,如果该标记没有对应通道的编码,那么就设置,否则不做任何事情。比如绘制一个点线图:
import { Chart } from '@antv/g2';const chart = new Chart({container: 'container',});chart.options({type: 'view',data: [{ year: '1991', value: 3 },{ year: '1992', value: 4 },{ year: '1993', value: 3.5 },{ year: '1994', value: 5 },{ year: '1995', value: 4.9 },{ year: '1996', value: 6 },{ year: '1997', value: 7 },{ year: '1998', value: 9 },{ year: '1999', value: 13 },],encode: { x: 'year', y: 'value' }, // 视图层级的编码children: [{ type: 'line' },{ type: 'point' },],});chart.render();
一个完整的编码是由 encode.type 和 encode.value 组成的。
编码后会按照编码方式生成指定通道下的数组。
| 编码方式 | type | value | 描述 |
|---|---|---|---|
| 字段编码 | field | string | 数据某一列的字段名 |
| 函数编码 | transform | (value, index, array) => number | string | boolean | Date | 通过回调函数指定通道和新生成的一些绑定 |
| 常量编码 | constant | any | 指定通道值为常量 |
| 数据编码 | column | number[] | string[] | boolean[] | Date[] | 指定通道值为一个数组 |
在 G2 中提供了语法糖,在大部分情况下 encode.type可以省略。
({type: 'point',encode: {x: { type: 'field', value: 'weight' },y: { type: 'field', value: 'height' },color: { type: 'field', value: 'gender' },},});
也可以利用语法糖简化写法:
// 语法糖({type: 'point',encode: {x: 'weight',y: 'height',color: 'gender',},});
指定通道和数据的某一列绑定:
(data) => data.map((d) => d[value]);
({type: 'interval',encode: { x: { type: 'field', value: 'name' } },});
// 语法糖({type: 'interval',encode: { x: 'name' },});
指定通道和新生成的一些绑定:
(data) => data.map(value);
({type: 'interval',encode: {color: {type: 'transform',value: (d) => (d.value > 100 ? 'high' : 'low'),},},});
// 语法糖({type: 'interval',encode: {color: (d) => (d.value > 100 ? 'high' : 'low'),},});
还可以通过函数编码的方式在多轴图中生成对应通道的图例。
import { Chart } from '@antv/g2';const chart = new Chart({container: 'container',});chart.options({type: 'view',autoFit: true,data: [{ time: '10:10', call: 4, waiting: 2, people: 2 },{ time: '10:15', call: 2, waiting: 6, people: 3 },{ time: '10:20', call: 13, waiting: 2, people: 5 },{ time: '10:25', call: 9, waiting: 9, people: 1 },{ time: '10:30', call: 5, waiting: 2, people: 3 },{ time: '10:35', call: 8, waiting: 2, people: 1 },{ time: '10:40', call: 13, waiting: 1, people: 2 },],children: [{type: 'interval',encode: {x: 'time',y: 'waiting',color: () => 'waiting',series: () => 'waiting',},scale: { y: { nice: true } },axis: { y: { title: 'Waiting' } },},{type: 'interval',encode: {x: 'time',y: 'people',color: () => 'people',series: () => 'people',},scale: { y: { independent: true } },axis: { y: { position: 'right', grid: null, title: 'People' } },},{type: 'line',encode: { x: 'time', y: 'call', color: () => 'call' },scale: { series: { independent: true } },},],});chart.render();
通过函数编码还可以在某些时候禁用某些通道。在 G2 中,当未定义 series 通道,且 color 通道已定义的情况下,会复制一份值到 series 通道,以实现分类的效果。 下面的例子中 color 通道被映射到连续字段上,此时如果 series 再被映射到连续字段上会影响渐变折线的显示,需要通过 series: () => undefined 的方式禁用。
import { Chart } from '@antv/g2';const chart = new Chart({container: 'container',});chart.options({type: 'area',autoFit: true,data: {type: 'fetch',value: 'https://assets.antv.antgroup.com/g2/temperatures3.json',},encode: {x: (d) => new Date(d.date),y: ['low', 'high'],color: (d) => d.high - d.low,series: () => undefined,},scale: { color: { palette: 'reds' } },style: { gradient: 'x' },axis: { x: { title: 'date' } },});chart.render();
指定通道值为常量,常常用于指定颜色通道或者大小通道,指定标记为某种颜色或者某个尺寸,这种编码方式不会生成对应通道的图例。
(data) => data.map(() => value);
({type: 'point',encode: {color: { type: 'constant', value: 'steelblue' },size: { type: 'constant', value: 10 },},});
// 语法糖({type: 'interval',encode: {color: 'steelblue',size: 10,},});
指定某个通道的值为一个数组。
() => value;
({type: 'line',encode: {x: { type: 'column', value: [0, 1, , 2, 3] },},});
对于一些大数据的场景,使用数组列会更适合,下面是一个简单的例子。
import { Chart } from '@antv/g2';const I = [0, 1, 2, 3, 4];const X = I.map((i) => ((i - 2) * Math.PI) / 2);const Y = X.map((x) => Math.sin(x));const chart = new Chart({container: 'container',});chart.options({type: 'line',data: I,encode: {x: {type: 'column',value: X,},y: {type: 'column',value: Y,},shape: 'smooth',},});chart.render();
当然,对于位置相关的视觉通道来说:例如 x 和 y 通道,往往不只需要一列数据,比如一个瀑布图,这个时候可以通过数组给一个通道指定多个列。
import { Chart } from '@antv/g2';const chart = new Chart({container: 'container',});chart.options({type: 'interval',data: [{ month: 'Jan.', profit: 387264, start: 0, end: 387264 },{ month: 'Feb.', profit: 772096, start: 387264, end: 1159360 },{ month: 'Mar.', profit: 638075, start: 1159360, end: 1797435 },{ month: 'Apr.', profit: -211386, start: 1797435, end: 1586049 },{ month: 'May', profit: -138135, start: 1586049, end: 1447914 },{ month: 'Jun', profit: -267238, start: 1447914, end: 1180676 },{ month: 'Jul.', profit: 431406, start: 1180676, end: 1612082 },{ month: 'Aug.', profit: 363018, start: 1612082, end: 1975100 },{ month: 'Sep.', profit: -224638, start: 1975100, end: 1750462 },{ month: 'Oct.', profit: -299867, start: 1750462, end: 1450595 },{ month: 'Nov.', profit: 607365, start: 1450595, end: 2057960 },{ month: 'Dec.', profit: 1106986, start: 2057960, end: 3164946 },{ month: 'Total', start: 0, end: 3164946 },],encode: {x: 'month',y: ['end', 'start'], // 等价于 y:'end', y1:'start'color: (d) =>d.month === 'Total' ? 'Total' : d.profit > 0 ? 'Increase' : 'Decrease',},axis: { y: { labelFormatter: '~s' } },});chart.render();
同时也可以通过 ${channel}${index} 的形式去分别指定:
// 和上面的形式等价chart.encode('y', 'end').encode('y1', 'start');